In this article you can find an overview of major financial crisis (so far), as we have experienced them in modern era of banking history. In some cases, they had very much in common, and their root-cause was either: (a) financial resp. accounting fraud (b) breach of internal guidlines and mismanagement (c) irrational behaviour of investors connected with moral hazard (d) ignorance of market evolution and global economic conditions or (e) personal failure. Below attached is the list of analyzed crisis in their ascending order, as they had happened in time.
- 1995) Barings Bank
- 1997) Asian Crisis
- 1998) LTCM debacle
- 2000) Dot-com bubble
- 2002) ENRON collapse
- 2008) Lehman Brothers and Co.
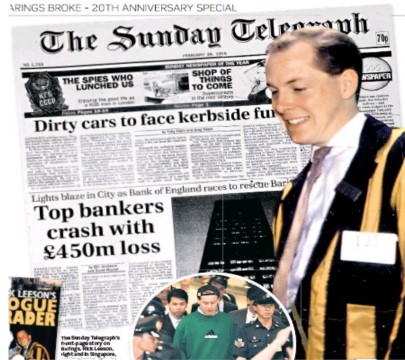
1995) Barings Bank
Founded in 1762, Barings Bank was one of the oldest and largest merchant banks in the world. During World War II, the assets of the bank were liquidated by the British government, in a bid to fund its war efforts. It was consequently bought by several influential names and remained an important market player till its demise.
What happened then there, was a master-class sample of personnal misbehaviour, violation of internal rules combined with weak controlling mechanism, which altogether brought this institution to its knees. What is quite clear, the Banks have learned from this case quite well, and Chinese Walls principle had been put in place with full segregation of duties.
In July 1989, only 22 years-old Nick Leeson joined the bank, in the Back-office Settlements department. Over the years, he assumed various critical roles in the bank, which he successfully fulfilled. For instance, in his posting at the Jakarta, Indonesia, branch, he successfully managed to settle £100 million worth of pending contracts, so naturally he deserved nice portion of professional credit. And this seems to have been part of the problem, as later he started to misuse his reputation while hiding his trades, that were far behind the secure line.
The Barings strategy
Jakarta-based Barings Branch (JBB) was carrying-out relativelly “safe” arbitrage trades, i.e. benefitting from the different prices for the same underlying assets – which were represented mostly by Nikkei 225 futures contracts, listed on the Osaka Securities Exchange in Japan and on the Singapore International Monetary Exchange (SIMEX). This strategy contained opening “long” position on one market while simultaneously being covered by “short” position for same contract on another market, so that residual risk was very low, but volumes needed to be traded large to benefit out of such a small differencies. Normally, the bank approved that all opened positions were counter-hedged during the same day. But, Nick Leeson went against the internal guidlines and held opened positions for a longer period, usually waiting for a higher move in his direction on the futures markets, however this approach was leading to a catastrophic accumulation of unhedged losses. In addition, there was a signifficant fault in organisation structure of JBB, as Leeson was heading both, the Trading Dept. as well as Back-Office Settlement Dept., which was breaching all usual competence rules.
Another part of JBB trading strategy were “switching” deals, whereas JBB was executing the clients orders on NIKKEI 225 futures, but switching between the better purchase price (not for client) on SIMEX (Singapore Stock Exchange) or OSE (Osaka Stock-Exchange). This came as result of tougher regulation applied for Japan-based brokers so that the vast part of futures trades on NIKKEI 225 moved to Singapore, where it was easier and “cheaper” to trade them. As a result of these developments, a new business opportunity arose. And this actually represented additional benefit to Leeson’s strategy when hidding real losses, while transferring the opened positions between Japanese and Singapore books of Barings Bank, respectivelly having used the argumentation that counter-deals to cover the opened positions have not been properly settled on another market.
And remaining business strategy was trading the „short stradle-options“ meaning that any bets on small movements of market index would generate small profit, but losses should have been limited by option premium. With an Short Stradle, a trader is de-facto selling both, short-call and short-put contracts with same exercise price, so that he/she is betting that underlying index would remain almost unchanged, respectivelly within reasonable tolerance (i.e. +/- 0,5%). Until Nick Leeson came in, all those afore mentioned strategies represented for Barings Bank quite safe business, whereas the profits were made from small market price differencies and positions were almost squared, without any signifficant exposure to major risk.
Magical Account “88888”
Amid this collapse, so called technical Account „88888“ had played a major role, as it was supposed to be a kind of error account, initially created for the purpose of netting minor trading losses, that were not yet settled and were pending to receive positive part of same transaction from another market (these positions should be closed within 24 hours). Nevertheless, Leeson gave specific instructions around July 8, 1992, to change the software to exclude Account “88888” from all market activity reports to Head-Office and the information was only used for the estimation of SIMEX’s margins requirements.
In line with this, Leeson’s main problem became the management of the flow of funds from London Headquarters to support the margin calls from SIMEX. This means that he needed to pursuade London to make more money available to him without having disclosed the real volume of concluded transactions, to be covered with these margins. For instance, Leeson invented the “last-minute” practice when executing offsetting trades about thirty seconds before market close, so that transactions from trading books of Barings Japan or Barings Singapore fell into Account “88888”, where they were kept for final settlement, which usually happened on next day ort he whole transactions was reversed in the books. With these so-called “transfer trades”, Leeson avoided disclosure of unhedged positions in its trading reports.
Final result of all these activities was that Structured Products Division, which included Leeson’s activities, showed an operating profit in 1994 which was five times higher above the budgeted figure. Nobody within Barings questioned these impressive figures from a business that should be virtually riskless. Even the Chairman of the Bank, Sir Peter Baring concluded that “it is not actually terribly difficult to make money in the securities business, these days”. However, no one except Nick Leeson, had precise overview of entire situation when it came to totally open positions.
Rising star going to fall
By the end of September 1992, Leeson had made such large unauthorized trades that Account 88888 held losses worth £6 million, but these losses were not disclosed to Headquarters. In fact, in December 1992, Singapore Branch actually reported profits worth £102 million to the British tax authorities. Further, Neesons confidence rose sharply, as he succeeded in reverting those „temporary“ losses into a profit until October 1993. Indeed, the total monthly trading volume through Account 88888 increased from 2,051 in July 1992 to a peak of 96,121 in September 1994. With these heavy and unauthorized trading activity, Barings Bank became the one of main brokers on both markets trading the futures (e.g. its share on SIMEX total trading volume was even close to 25% in November 2014).
An internal audit procedure made the Bank Headquarters even aware of some discrepancies in the accounting reports, but they chose to trust the argumentation made by Nick Leeson, who was considered to be rising star.
In January 1995, Nick Leeson was again questioned by the audit officials regarding missing pieces in his accounting trail. It was at this time that he became really nervous and attempted to reverse all his losses, by betting everything he had.
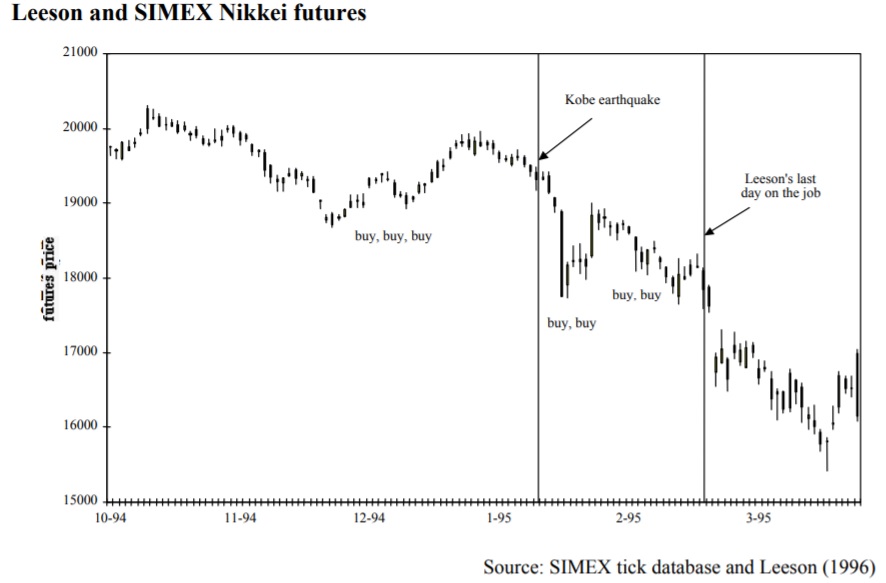
On January 16th, 1995, with the aim of “recovering” his losses, Leeson placed a short straddle on market indexes, betting that Nikkei would not drop below 19,000 points. But the next day, the unexpected earthquake in Kobé district shattered his strategy and Nikkei lost 7% in the upcoming week, which enhanced his losses further. At this moment, Leeson decided to play „All or nothing“ and doubled his bets to recoup the losses. This represents actually a gamblers fault, and only a few professional traders would afford running such a risk with open positions and increased bets.
When Nikkei fell even below 18,000 level, Nick Leeson took a USD 7 billion futures position in Japanese equities and securities linked to the variation of Nikkei. So that, he was “long” on Nikkei, as the Japanese economy seemed to be on the verge of recovery after 30 weeks of recession. Following these massive bets, he really moved the market in his direction, as he sometimes succeeded to do so, but only for very short period. Just, after a week, Nikkei was again heading more towards the south and market didn’t recover as per his expectations, so that he finally decided to escape from country to Kuala Lumpur, Malaysia.
Shortly after this, Headquarters initiated in-depth investigation into accounting records and surprisingly total losses in the error account stood at £862 million at the end of January 1995, which further increased to final bill of £1 billion (close to USD 1,5 billion). This amount was even doubling the valuation of the bank’s capital available for trading activities. On February 26, 1995, after a frantic bailout attempt by the Bank of England, the bank was declared insolvent. Approximately 1,200 people lost their jobs alone in Singapore, after the collapse.
Consequences
Consequently in March 1995, Barings Bank with its 233 years history was officially acquired by Dutch investment group, ING Groep NV, for a meager £1, to form the subsidiary, newly named ING Barings. This was later sold to ABN Amro, in 2001.
Leeson himself, was sentenced to six and a half years in prison in Singapore, where he published a book called Rogue Trader. Today, he serves as advisor in the financial industry, helping-out with discussions on improper internal controls in financial institutions.
1997) Asian crisis
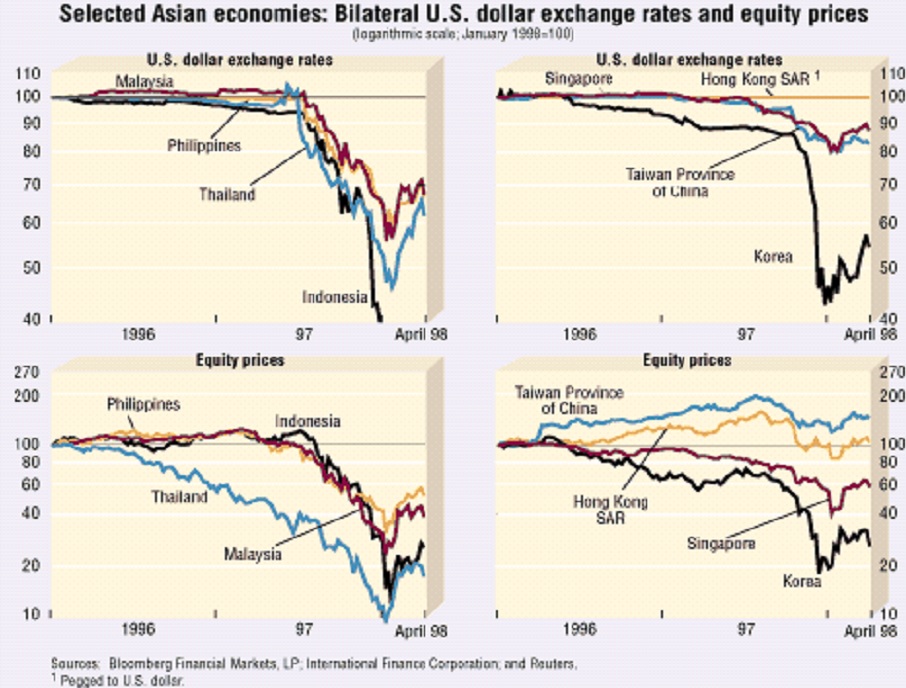
The following crisis, which was also called Asian flu, started to burst only some 2 years after the Barrings collapse. Needless to say that in this case no individual mistake or professional misbehaviour has caused it, thus only some Asian developing countries (like Indonesia, Taiwan, South Korea, Singapore etc.) became the victims of global circuimstances, however their part of the game was in weak regulation of financial sector, not enough flexible monetary policy, reluctancy of local governments to respond. And finally, the moral hazard of foreign investors was also to blame.
At the center of the crisis were for years admired some of the most successful emerging market economies, owing to their rapid growth and the striking gains in their populations’ living standards. With their generally prudent fiscal policies and high rates of private saving, they were widely seen as models for many other countries.
What went wrong?
The financial atractiveness of these Asian quickly-developed countries led foreign investors to underestimate their underlying economic weaknesses. So, what were the reasons that these markets were so appealing to foreign investors having encouraged higher flows?
- international investors searched for higher yields at a time when investment opportunities appeared less profitable in Europe and Japan, owing to their sluggish economic growth and low interest rates and local economies and corporate segment needed more funds to finance their growth;
- the prolonged maintenance of pegged exchange rates for local currencies (to U.S. Dollar) was somehow seen as implicit guarantee of well predictable exchange value in the future, which have further encouraged external borrowing and led to excessive exposure to foreign exchange risk in both the financial and corporate sectors;
- Some commentators have argued that the international community’s assistance to countries suffering from financial crises may have played some part on more reckless behavior of borrowers, lenders, and investors – a phenomenon that is known as “moral hazard.” Such perception of IMF readiness to act if necessary, might have contributed to the problem, that investors did not assess potential risks properly, and relied heavilly on financial bail-out in worst case respectivelly, that IMF would not let these markets fall at all.
And what was the result?
- a build-up of large external deficits and inflated property and stock market values that later on must have corrected this over-valuation which resulted into colossal stock market crashes (see table below);
- a lack of enforcement of prudential rules and inadequate supervision of financial systems, coupled with government-directed lending practices that led to a sharp deterioration in the quality of banks’ loan portfolios;
- problems of governance and political uncertainties, which worsened the crisis of confidence, fueled the reluctance of foreign creditors to roll over short-term loans, and led to downward pressures on currencies and stock markets.
- wide swings in the dollar/yen exchange rate contributed to the crisis through shifts in international competitiveness that proved to be unsustainable (in particular, the appreciation of the U.S. dollar from mid-1995, especially against the yen, and the associated losses of competitiveness, contributed to their export slowdowns in 1996–97 and even wider external imbalances).
To contain the economic damage caused by the crisis, the affected countries introduced corrective measures. In period of 1997/98, the IMF provided $36 billions to support reform programs in the three worst-hit countries that were Indonesia, S.Korea, and Thailand. Along the IMF there were provided also international support packages totaling almost $100 billion.
In these three countries, unfortunately, the state authorities’ initial hesitation in introducing reforms and in taking other measures to restore confidence led to a worsening of the crisis by causing declines in currency and stock markets that were greater than a reasonable assessment of economic fundamentals might have justified. This overshooting in financial markets worsened the panic and added to difficulties in both the corporate and financial sectors. In particular, the domestic currency value of foreign debt rose sharply.
Moral hazard
The Asian crisis has brough-up this new term, that became centre-point for further discussions and analysis many times later, as another financial crisis appeared to have one aspect in common. In fact, the previous experience with Great Depression taught policymakers that the damage caused by systemic financial crises can be devastating and can have a global impact. Based on that, IMF is widelly expected to step-in and protect the wide-spread of local turmoils into the global markets. However, it can also increase the incentive for risk-taking by both potential borrowers and lenders, so that lenders can take excessive risks if they believe that an IMF loan will enable a government or its banks to pay their debts if the country fall into financial trouble. Despite it took some more time, the rules of the game have also adapted to this potential risk, so that any future financial assistance have been accompanied with tough conditions that were not easy to swallow by all counter-parties on market.
For instance, how the upcoming crisis were tackled:
a) in case of Greek financial collapse, the private Bond-holders were forced to accept re-structuring of outstanding debts switching into a longer period and with substantial hair-cut of their nominal value;
b) during the 2008 global crisis, ECB/FED subsidies to troubled financial institutions were conditioned with change of ownership or substantial divestment undertaken by those entities etc.
In addition, these crisis also very often reflect misjudgments or “irrational exuberance” that lead investors and banks to underestimate the risks in emerging markets (and then to overreact when sentiment begins to change). Therefore, in order to avoid such overreaction, the market transparency seems to be most essential to secure that all participants dispose with reliable information and are capable of proper judgement for the future development.
1998) LTCM Debacle
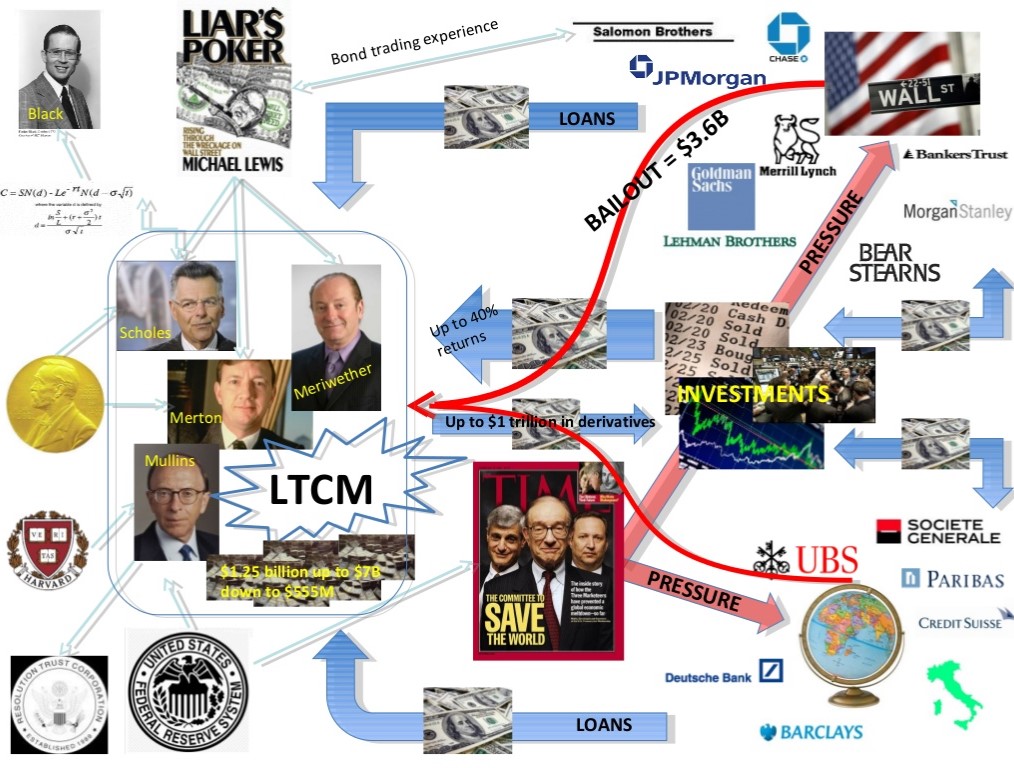
LTCM was the acronym for “Long Term Capital Management”, an famous hedge fund, established and managed by John Meriwether. As former Salomon Brothers bond trader, he approached Merrill Lynch to raise necessary funds and launched LTCM. The strategy, how to convince potential investors was simple; to be accompanied by the most brilliant minds that could make his fund succeed. That’s why he assembled an all-star team of traders and academics in order to gather various academics’ knowledges (quantitative models…) and traders’ skills (market judgement, execution capabilities) such as:
- Lawrence Hilibrandt (holder of a diploma of the MIT and ex-trader at Salomon),
- Eric Rosenfeld (former professor at Harvard),
- Victor Haghani (holder of a diploma of the London School of Economic),
- William Krasker and Gregory Hawkins (Phd in Economics at the MIT),
- David Mullins (vice-chairman of the FED) and finally,
- Robert Merton (professor at Harvard) and Myron Scholes (professor at Stanford), recipients of the Nobel Prize in Economics.
Thats an irony of whole story, that last two mentioned gentleman (Merton and Scholes) received an Nobel prize in Economy for having worked and completed the valuation formulas for Options, which represented more than honorable award for their academic work. Especially in the context of their top positions within LTCM, their award acted as guarantee for funds investors that their money will be properly handled.
This team convinced sophisticated investors, including many large investment banks (and even their top managers), to invest more than $1.3 billion. The conditions to become an investor in LTCM were quite harsh: each of them should invest at least $10 million, which were blocked during 3 years, without any possibility for the investor to have a look at the transactions and with the highest commissions at that time.
The Funds strategy
LTCM’s main strategy was to make convergence trades. Convergence trades involve two assets whose prices are slightly different at moment, but are expected to converge during the time and, at maturity should be equal. Early trades concluded by LTCM were, for example:
- to buy under-priced off-the-run US treasury bonds (it means bonds that were issued before the most recently issued bond of a particular maturity), which are less liquid and so less appealing for investors (and a bit cheaper therefore), while
- go short on-the-run, more liquid treasuries (more expensive as well). Basically, with these trades LTCM was betting on the “convergence” effect, whereas their expectation was that under normal conditions, less expensive securities would appreciate and more expensive one would depreciate in time.
They were naturally focusing on secure assets like U.S. government bonds, Japan, European sovereign bonds and Emerging markets sovereign bonds (e.g. Russia, Turkey etc.), hedged back to U.S. dollar. The firm capitalized on advances in data mining technology and a greater sophistication of the finance models on which their internal analysis was based.
LTCM realised also some speculative transactions, that were based on assumption that over-average spreads between two assets will return to their historical averages (reflecting their strong historic correlation and whose yield spreads are outside the normal range). Such trades however brought in higher risk, as they were betting on change in yield spreads in any direction between:
- U.S. government bonds and U.S. corporate bonds,
- triple-A-rated corporate bonds and junk bonds,
- Government debts of different foreign nations (e.g., Argentina, Brazil, China, Korea, Mexico, Poland, Taiwan, Russia, and Venezuela).
Because the changes in yield spreads were usually only in simple-digit percentage points per annum, the Fund needed the larger leverage effect as much as possible in order to deliver its investors significant profit that would beat the stock market return, but with lower risk rate. Especially in period of 1995-2000, the so called „dot-com“ stocks traded on Nasdaq were delivering annual double-digits profit which represented hard competition.
In the first years, this strategy scored a huge success as LTCM marketed itself as providing superior returns for risk that was considered to be lower than the US equity market. In 1994, LTCM gained 20% while the S&P 500 was up only 1.3%. The similarly successful results were delivered also in following period:
- in 1995, profit was 42.8% vs. S&P 500 was up 37.2%;
- in 1996, up by 40.8% vs. S&P 500 was up 22.6%;
However, in 1997, after two years of returns running close to 40%, the fund that attracted so much investros, was achieving “only” a 27% yield, that was comparable with the return on US equities that year. At the beginning of 1998, the fund had equity of $5 billion and borrowed funds over $125 billion — a leverage factor of roughly 30:1. But, LTCM’s partners believed, on the basis of their complex computer models, that the long and short positions were highly correlated and so the net risk was small. Therefore, they were not concerned about further swaps position valued around $1.25 trillion of notional amount, resp. equal to 5% of the entire global market.
First catastrophe looming
In August 1998, Russia devalued its currency and declared a moratorium on 281 billion roubles ($13.5 billion) of its Treasury debt. Russia’s default on its government obligations was the starting point for debacle of the fund.
Despite the fact that LTCM managers had calculated with mathematical certainty that it was unlikely to lose more than $35 million on any single day, on that one Friday in August, it had just dropped $553 million — 15 percent of its initial capital.
LTCM believed that its positions in Russian bonds were hedged by selling in the extent that a default on the bonds would undeniably lead to a collapse of the currency and so a profit could be made in the foreign exchange market that would outweigh the losses. Unfortunately, LTCM concluded the rubble hedging strategy with Russian banks, which collapsed too and the Russian government prevented the foreign institutions with further trading in its currency. This movement was so intense that LTCM’s equity dropped to $2.3 billion, which was more then 50% of Fund Own funds.
Under pressure, John Meriwether decided to permit potential investors to invest in the fund “on special terms” and has forbiden existing investors to withdraw more than 12% of their investment. As Russia’s troubles became deeper and deeper, fixed-income portfolio managers began to shift their assets to more liquid assets like U.S. Bonds/T-Bills. This global flight to liquidity hit the on-the-run Treasuries (most recently issued securities) like a freight train. Reflecting the increasing demand for them, the yields spreads between on-the-run Treasuries and off-the-run Treasuries widened dramatically, what has torpedoed the main part of LTCM business model.
What LTCM had failed to account for is that a substantial portion of its balance sheet was exposed to a general change in the “price” of liquidity. If liquidity became more valuable (as it did following the crisis) its short positions would increase in price relative to its long positions. This was essentially a massive, unhedged exposure to a single risk factor. As an aside, this situation was made worse by the fact that the size of the new issuance of U.S. Treasury bonds has declined over the past several years. This has effectively reduced the liquidity of the Treasury market,
LTCM had started the year 1998 with $4.67 billion of Own Equity. Since the end of April, it had lost more than a third of its equity. In September 1998, LTCM’s equity kept on melting down and dropped further. At the end of this month, it stood at only $400 million.
Banks began to doubt of the fund’s ability to meet its margin calls but could not move to liquidate due to a fear that it will trigger a crisis that will cause huge losses among the fund’s counterparties and potentially lead to a systemic crisis because all of the leveraged Treasury bond investors had similar positions and heavily linked with LTCM.
Innevitable bail-out
Peter Fisher, executive vice president at the NY Fed, decided to take a look at the LTCM portfolio and afterwards he was pretty much surprised by what he saw. It was clear that, although LTCM’s major counterparties had closely monitored their bilateral positions, they had no idea of LTCM’s total off balance sheet leverage. LTCM had done swap upon swap with 36 different counterparties. In many cases it had put on a new swap to reverse a position rather than unwind the first swap, which would have required a mark-to-market cash payment in one direction or the other. LTCM’s on balance sheet assets totalled around $125 billion, but total leverage was increased further by LTCM’s off balance sheet business whose notional principal ran to around $1 trillion.
However, according to LTCM managers their stress tests had involved looking at the 12 biggest deals with each of their top 20 counterparties. That produced a worst-case loss of around $3 billion. But on that Sunday evening it seemed the mark-to-market loss, just on those 240-or-so deals, might reach approximately $5 billion. And that was ignoring all the other trades, some of them in highly speculative and illiquid instruments.
On next days, bankers from Merrill, Goldman and JP Morgan continued to review the problem. Goldman Sachs, AIG and Warren Buffett offer to buy out LTCM’s partners for $250 million, to inject $4 billion into the fund and run it as part of Goldman’s proprietary trading operation. This was the best offer to be given at that time, but was not accepted.
Afterwards, the Federal Reserve Bank of New York, acting to prevent a potential systemic meltdown, organised a rescue package under which a Consortium of leading investment and commercial banks, including LTCM’s major creditors, agreed to inject $3.5-billion into the fund in exchange for 90% of LTCM’s equity. Many banks were hit by a substantial write-off as a result of losses on their investments. In addition, some EU-based banks put in another money reaching a total fresh equity of $3.625 billion. It was the very first time that the Federal Reserve Bank of New York took the step of facilitating a bailout of a private hedge fund, out of fear that a forced liquidation might jeopardize financial markets.
Under the „Consortium“ leadership, all positions of LTCM were closed during the period of upcoming 15 Months and whole notional amount under the rescue package was returned to the Banks consortium in December 1999.
What was the impact?
Quite clearly, this collapse meant worthful experience for investors that abnormally higher returns are often associated with increased risk. Further, LTCM was not disclosing full picture on its position when it comes to Off B/S position and total Leverage.
Naturally, this has resulted into higher regulation of the Hedge funds, more detailed reporting obligations and cautious approach of the banks in lending the money into Funds, which have purely speculative business model. Following crisis, that was connected with Dot-com bubble, has even deepened the restrictions from side of the banks in their exposure towards the stock market and similar highly volatile instruments.
2000) Dot-com bubble
This case examines the Dot-com Bubble, which started to inflate during the late-1990s and bursted in early-2000. The damage done to the investors was absolutelly huge and only NASDAQ traded shares lost on their value around $ 5 trillion during the half a year in 2000. But the biggest damage was represented by lost confidence in shares as serious investment tool and entire approach of banking sector towards the stock market has adverselly changed. More than 50% of companies were delisted from NASDAQ and among the largest 15 companies in the index back in 2000, only four remain in the top 15 today: Microsoft, Cisco, Intel and Qualcomm. These companies have proved to have sound business concept and added value bringing to their investors. However, over the period of upcoming 15 years, only Qualcomm and Microsoft stocks had reached positive returns for their investors (up 1.54% and 1.34% annually, respectively), while Cisco and Intel shares were still down from their peak in 2000. This only demonstrates, how much over-valued those shares were at that time of financial crash.

New vs. Old economy
Dot-com term has been used to describe the companies, that were characterized by their internet activities (e.g. web-sales, merchandising, online research, tele-marketing etc.), so that so that their web pages were better known than their business results. As they were established in period of internet growth (and its usage for business), it was somehow believed that they will be successful at any costs, and even negative results were considered as temporary based on positive outlook for near future. Further, in this period, there was a new phenomen coming to market, called „IPO“ (Initial Public offering – subscription of the shares before their listing for a fixed price), which was securing the access to capital markets for those „sexy“ companies, which helped to raise solid money for their founders and managers. Given the higher attractiveness of dot-com entities, the demand for having those shares was highly exceeding the offer, so that the market prices were sky-rockeeting through the roof and gains were usually exceeding 100% during the first trading days after IPO. This was very common start-up process for NASDAQ listed companies, which had just very short track-record.
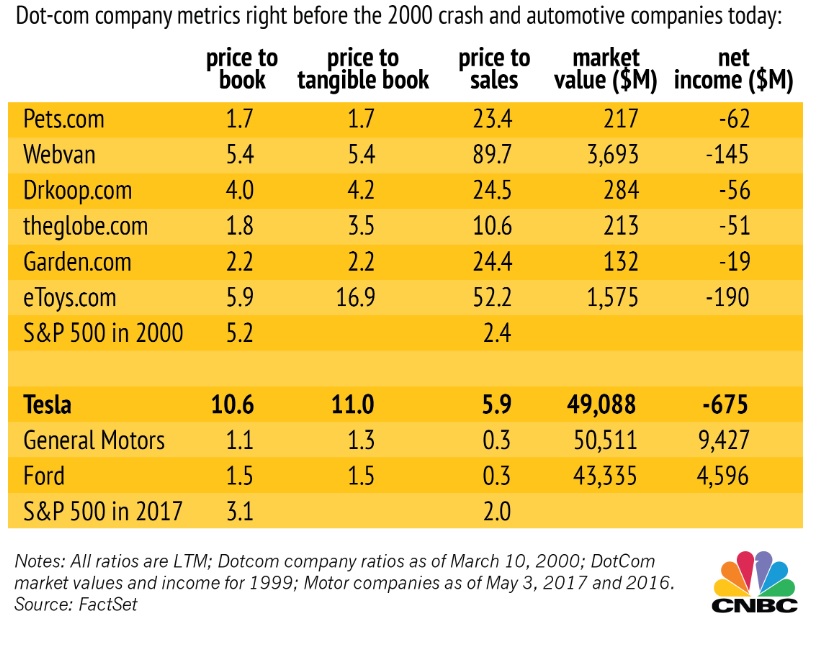
On the contrary, there were traditional companies with a long history sometimes exceeding 100 years, that were listed within the Dow Jones Industrial Composite. But these companies were viewed at that times, to be a skeleton item, which cannot grow any further, and cannot even compete with NASDAQ companies, when it comes to future prospect. As a result, NASDAQ companies were over-priced to insane level, as typically measured via Price to Earnings ratio, which very often shot-up to 100x (instead of common 20x). For instance, below attached table shows comparison of Internet shares with Auto producers, whereas P/E ratio was in range of 20x-90x, while SP500 stocks median was only 2x at that time. To justify the ginormous valuations of New Economy stocks, Wall Street analysts parrot that equity markets have entered a new paradigm: “This time it’s different!”.
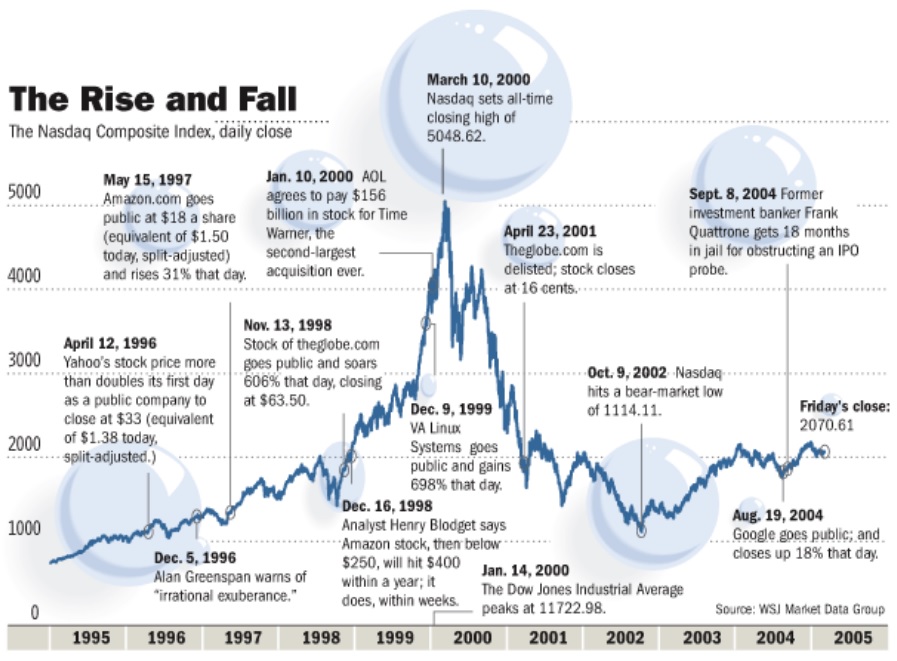
The Internet Boom starts with the founding of Netscape in 1994, whose eponymous browser revolutionalizes access to the Web. Only 5 years later, AOL acquires it for $10 billion in March 1999, the equity market is in a feeding frenzy as fundamental metrics are cast aside. However, the first signals were popping-up a bit earlier, but it did nothing to market sentiment and hysteria on stocks. In 1997, Microsoft was accused of monopoly and Bill Gates (founder) was forced to resign later on. This was quite a painful period for this blue-chip company as Microsoft was faced with being split off, in the end. As a result, top analyst of Goldman Sach suggested to underweight the stock of internet corporations, which was the first time in 10 years.
Nevertheless, as boom of technology stocks was not about to fade away, this was also providing a life-blood for „old-economy“ companies. And Dow Theory warning signals arrive well-ahead of the Dot-com Bubble burst. In mid-April 1998 the Dow Jones Transportation Average fails to confirm new highs of the DJIA at 9.172, so in following weeks the DJIA falls 19% from mid-July to end of August. Yet, buoyed by newly announced technology shares IPO and acquisitions, the DJIA regains its legs to not only recover, but rise to new record highs; by May 1999 the DJIA stands at over 11000. Once again, the DJ Transportation does not confirm DJIA, sending a second selling signal to the market, however this was still ignored as further market growth was fueled by announced 2nd largest acquisition in modern history of Time Warner by AOL Group for consideration of $156 billion. This and other events supported DJIA in its parabolic rise until mid-January 2000, when the euphoria partially starts to loose the steam. Then, until the September 2000, DJIA lost around 30%.
Was FED aware or even to blame for it?
Liquidity (excess) acts as the lifeblood for most financial bubbles. For the Dot-com Bubble, the tendency for Fed Chairman Alan Greenspan to lower interest rates, seems to have also played certain part on fuelling the rally in stocks. Though there was not observed any direct correlation between these FED money-relaxation actions and further spikes in NASDAQ, it may be straightforward to convey the conclusion that Investors were aware of having access to cheap money.
On the contrary, Alan Greenspan was publicly known to be „in favor“ of old Economy and has made clear for several times, that the valuation of new Economy companies might not be sound (most famous was his December 1996 “irrational exuberance” speech). However, he might have been aware of the risk of sending a Black swan to the market, so in practice, the Fed continued in lowering target Fund Rates (three times in 1998). Following the LTCM debacle, the markets and institutional investors were searching for a safe harbor (which is traditionally seen in U.S. Dollar and US Government bonds/T-Bills), so that funding rates for US safe assets kept on decreasing trend. Eventually, as New Economy stocks reached their final apex in March 2000 and started to slide, the Fed, as though attempting to revive a cardiac arrest patient, lowered further rates eleven times in 2001.
But, to no avail, the Nasdaq Composite ultimately collapsed by 72% until September 2001 as fear takes over the market. From peak to trough, over $5 trillion was wiped out of share holdings in Nasdaq Composite companies (March 2000 to October 2002).
Lessons learned
Euphoric emotions and greed drive financial bubbles; retail and professional investors, Wall Street analysts, regulators, politicians, and media can succumb to investing mania. Fundamental factors of financial assets (e.g. P/E Ratio, EBITDA, ROA, ROC, Leverage etc.) generally move within in a given trading range. When stocks trade at fundamental factors excessively above historical range, this acts as a warning signal that the probability of a correction is rising. Likewise, Dow Theory and small cap stock performance can indicate increased chance of a correction. Finally, financial bubbles tend to be liquidity-driven events, thus focus on the actions of monetary authorities, not on their rhetoric, on whether liquidity is being increased or decreased. Nevertheless, rising interest rates have significantly smaller effect on New Economy stocks than on CAPEX and Debts-heavy-loaded Old Economy stocks.
2002) ENRON Scandal
This event represented very serious case of mismanagement combined with weak accounting discipline that has led to major accounting fraud even supported by Audit company. All of that resulted in the one of the biggest bankruptcy filings in the history of the United States, as Enron Corporation held more than $60 billion in assets. But that was not entire bill, as it was also acompanied with the dissolution of Arthur Andersen LLP, as a direct consequence of worst reputation damage in modern history. Arthur Andersen had been among the „TOP5“ largest auditing and consulting companies in the world (next to Deloitte, KPMG, Ernst and Young and PwC), active in the business since 1913 with more than 85,000 employees operating in 84 countries. And finally, this had also spured additional legislation designed to improve accounting standards and practices, to improve corporate governance etc., altogether aimed to bring higher transparency into the financial world. For instance, so called „SOX“ (Sarbanes-Oxley Act) measures had been adopted following this bankruptcy, that are in place until now.
Enron was established in 1986, as legal successor of two merged entities, Houston Natural Gas Corporation and InterNorth, Inc. After the U.S. Congress adopted a series of laws to deregulate the sale of natural gas in the early 1990s, the company lost its exclusive right to operate its energy pipelines. In order to boost the business revenues, Enron transformed itself into a trader of energy derivative contracts, acting as an intermediary between natural-gas producers and their customers. These trades allowed the energy producers to mitigate the market risk of energy-price fluctuations by fixing the selling price of their products through a contract negotiated with Enron for a fee.
The good times ahead
Under Skilling’s leadership, Enron soon dominated the market for natural-gas contracts, and the company started to generate huge volume of revenues, but profits were somehow only modest (USD 979Mio in 2000). Enron management also gradually changed the culture of the company to emphasize aggressive trading. They created an intensely competitive environment within the company, in which the focus was increasingly on closing as many cash-generating trades as possible in the shortest amount of time.
Below attached chart displays the comparison of generated sales as per employee, which clearly might have indicated some problems at that time. For instance, revenues per employee generated by Exxon Mobil were almost three times lower, while with General Electric, were more then ten-times lower, when compared with Enron.
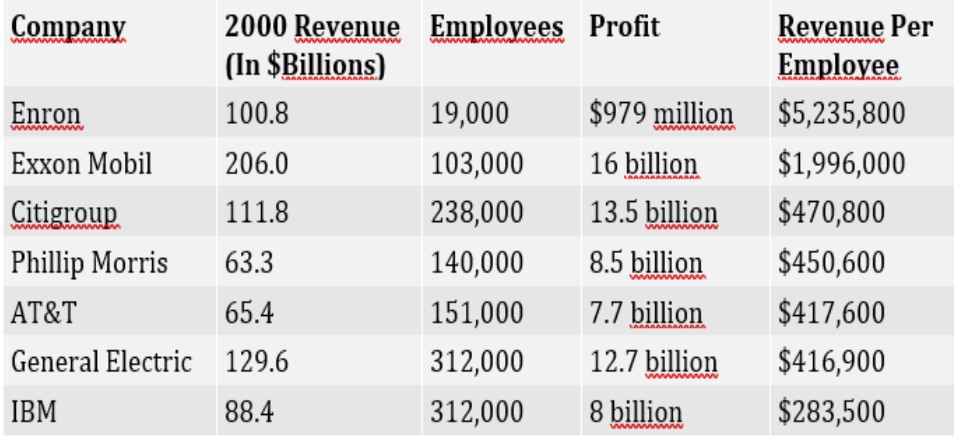
Enron generated huge revenue numbers, with intention of declaring themselves as primary market maker, by buying and selling the same goods/ contracts over and over. Even some Wall Street analyst questionned this practice, as they were aware of the fact, that Enron might resell to one customer the same electricity they sold to another,” (analyst at A.G. Edwards for instance). Further, some of this trading was done between Enron and its supposedly independent partnerships. Each individual trade was accounted for as revenue at its full value. On the other hand, Enron was allowed to do this because a task force of the Financial Accounting Standards Board (FASB) could not decide how energy contracts should be accounted for. In period, between 1996 and 2000, Enron’s revenues increased by more than 750%, rising from $13.3 billion in 1996 to $100.8 billion in 2000. This expansion of 65% per year was unprecedented in any industry, including the energy industry, which typically considered growth of 2–3% per year to be respectable.
The bull market of the 1990s helped to fuel Enron’s ambitions and contributed to its rapid growth. There were deals to be made everywhere, and the company was ready to create a market for anything that anyone was willing to trade. It thus traded derivative contracts for a wide variety of commodities—including electricity, coal, paper, and steel and even for the weather. An online trading division, Enron Online, was launched during the dot-com boom, and the company invested in building a broadband telecommunications network to facilitate high-speed trading.
The bad times ahead
As the boom years came to an end and as Enron faced increased competition in the energy-trading business, the profit margins shrank rapidly. Under pressure from shareholders and to fulfill the market expectations, company executives began to rely on dubious accounting practices, including following:
- Mark-to-market accounting allowed the company to book unrealized future (estimated) gains from some trading contracts into current income statements, thus giving the illusion of higher current profits.
- Troubled operations of the company were transferred to so-called special-purpose-entity”entities (SPEs), which are essentially limited partnerships created with outside parties. Although many companies distributed assets to SPEs, Enron abused the practice by using SPEs as dump sites for its troubled assets. Transferring those assets to SPEs meant that they were kept off Enron’s books, making its losses look less severe than they really were. Ironically, some of those SPEs were run by Fastow (CFO) himself, so that they did not appear nor in Enron consolidated results.
- Creative accounting incl. purposefully mis-classified loan transactions as sales, usually booked close to quarterly reporting deadlines on stock market, to support positive impression on continuing growth.
The severity of the situation began to become apparent in mid-2001 as a number of analysts began to dig into the details of Enron’s publicly released financial statements.
Even Enron CEO Jeff Skilling found it difficult to explain to analysts where all the numbers on the company’s financial statements came from. He stated in an interview that the numbers provided to analysts were “black box” numbers that were difficult to pin down due to the wholesale nature of Enron.
An internal investigation was initiated following a memorandum from a company vice president, and soon the Securities and Exchange Commission (SEC) was investigating the transactions between Enron and Fastow’s SPEs.
Game over
In October 2001, negative insider news were leaking-out to the market that third quarter results would disclose even operating loss, despite the record level of reported revenues of $138.7 billion. However, the level of revenues were already of the analysts radar as they rather started to focus on Profit margins and their long-term sustainability. A full blow-out to investors confidence was caused by an after-tax nonrecurring charge of more than $1 billion that were supposed to be connected with various unsettled litigations and acquisitions costs, that were confirming the rumours that not every potential risks had been properly disclosed to investors.
As the details of the accounting frauds emerged, the stock price of the company plummeted from a high of $90 per share in mid-2000 to less than $1 by the end of November 2001, taking away with it the value of Enron employees’ 401(k) pensions, which were mainly tied to the company stock.
Top management incl. Lay and Skilling resigned, and Fastow was fired two days after the SEC investigation started. Within 3 days, an unprecedented amount of material had been shredded, and e-mails and computer files deleted, in Houston and several other regional offices. The SEC formally subpoenaed also Andersen for Enron-related material on November 8, though the shredding came to a stop only the following day.
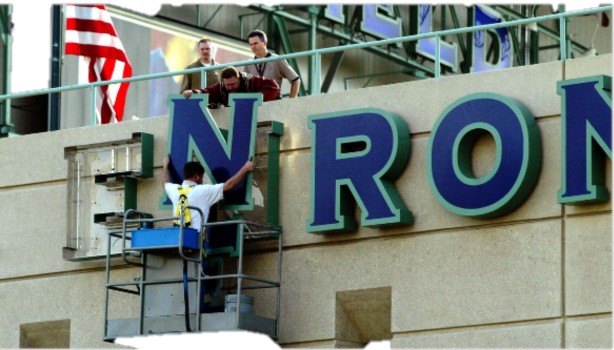
On December 2, 2001, Enron filed for Chapter 11 bankruptcy protection. Also, Arthur Andersen came under intense scrutiny and eventually lost a majority of its clients. The damage to its reputation was so severe that it was forced to dissolve itself.
Enron case also revealed how the combination of more complex financial statements, more aggressive accounting techniques, greater concern for customer satisfaction, greater dependence on consulting fees, and smaller cost-effective sampling techniques created many problems for auditing firms. For instance, Arthur Andersen’s Houston office was billing Enron $1 million per week for auditing and consulting services, and Enron became one of the most important client.
Lastly, Arthur Andersen came under criticism that it was providing Auditing as well as Consulting services to Enron, which was later seen as conflicting position, because creative accounting was surely more dominant and important to Client needs than prudential book-keeping and auditing (which is more essential for shareholders, investors, market participants and regulators). This has also triggered another industry-shapping measures, whereas the auditing and consulting services had been more separated to secure proper approach and less conflict of interests.
2008) Lehman Brothers and Co.
With no doubts, this was a biggest crises in modern financial history, and though the bankruptcy of Lehman Brothers coined it, there were also another important actors in this drama. However, to understand all the circuimstances and role of the players, we need to go back into 2007, where it all had begun.
In quite silent mood, Bear Stearns was heading to a disaster, without any notice from sorrounding counterparties involved in the business, nor any analysts or commentators. And that was most surprising thing about it, as Bear Stearns was among the „first league“ investment banks including JP Morgan, Goldman Sachs, Merill Lynch and …Lehman Brothers. These firms were providing wide range of investment banking services like debt capital placement, brokerage and stocks trading, risk capital lending, foreign currencies trading, consulting services and others.
Bear Stearns was founded in 1923, it produced $9 billion in revenues, earned $2 billion in profits, and employed over 13,000 employees worldwide. Its stock market capitalization was $20 billion in 2007. This well-respected firm was involved next to regular investment banking services, also in the hedge fund business investing into assets-based securities, which was found to be a risky business, in a while.
In April 2007, High-Grade Structured-Credit Strategies Fund and Enhanced Leverage Fund, owned $20 billion in collateralized debt obligations (CDO). These instruments were derivatives representing mortgage-backed securities. They served to finance mortgage loans provided to individuals. They started losing value in September 2006 when housing prices began falling, as the subprime mortgage crisis started to loom. This crisis was caused by pure speculation on rising real-estate values, so that LTV ratio was key driver in the financing. Real estate market dealers were encouraged by sales bonuses to sell as much mortgages as possible without any due care about the individuals ability to repay the loans. In order to be able to place such obligations (Bonds) on capital markets, they were secured with mortgage rights on the financed properties that were bundled together in this derivative.
Bears are coming for Bear
In May 2007, the Enhanced Leverage Fund announced its assets had lost 6.75 percent. Two weeks later it revised that to an 18 percent loss. Investors began pulling out their money. Then the fund’s bankers called in their loans. Parent company Bear Stearns scrambled to provide cash for the hedge fund, selling $3.6 billion in its assets. With these proceeds Bear Stearns agreed to buy the securities from Merrill and other lenders for $3.2 billion. However, the market players started to be more cautious as Bear Stearns’ reputation was already damaged.
And the damage was done, when Bear Stearns announced its financial loss of $854 million for the fourth quarter, which happened first time in 80 years history. It was mainly caused by a $1.9 billion write-off of its subprime mortgage holdings. As a result, Moody’s downgraded its debt from A1 to A2. But the real-estate market prices continued in the deterioration, which opened a new questions about the proper valuation of CDOs. Further, the results revealed higher than anticipated rates of delinquencies with mortgage loans leading to increased foreclosures of the properties, which were used as collateral within CDOs.
In January 2008, Moody’s further downgraded Bear’s mortgage-backed securities to B. That was junk bond status and Bear Stearns was having trouble raising new capital to stay afloat. Such event triggered an old-fashioned bank run on Bear Stearns, so that its clients pulled out their deposits and money.
At 7:45 p.m. on March 13, Bear Stearns’ only had $3.5 billion left in cash. How did that happen so quickly? Like many other Wall Street banks, Bear relied on short-term loans called repurchase agreements. It traded its securities to other banks for cash. The so-called repo agreement lasted from overnight to a few weeks. When the repo ended, the banks simply reversed the transaction. The lender earned a quick and easy 2-3 percent premium. This was a printing machine for a fresh money, while Bear Stearns had sufficient portion of attractive securities in its portfolio.
Nevertheless, reflecting the recent downgrade of Bear Stearns Bonds, no one wanted to get stuck with the Bear’s junk securities. And Bear hemorrhaged cash when the other banks called in their repos and refused to lend more money.
However, another question is popping up on the surface. How comes that such a successful financial firm could go bust so quickly? In the annals of Wall Street, there was hardly a more sudden collapse than the fall of Bear Stearns. The main cause was said to be a run on the bank as nervous investors pulled assets from the firm. Naturally, Bear Stearns had over-average leverage ratio around 35x, meaning it had equity of $11 billion and total assets of $395 billion. This was a result of aggressive dividend policy, given the annual profits around $2 billion, so that Bears were not equipped with better capital buffer. On the other hand, even their rival Merill Lynch reported even higher loss for Q3 2007 above $8,4 billion due to subprime mortgages, but this had not hurt Merill so much as Bears.
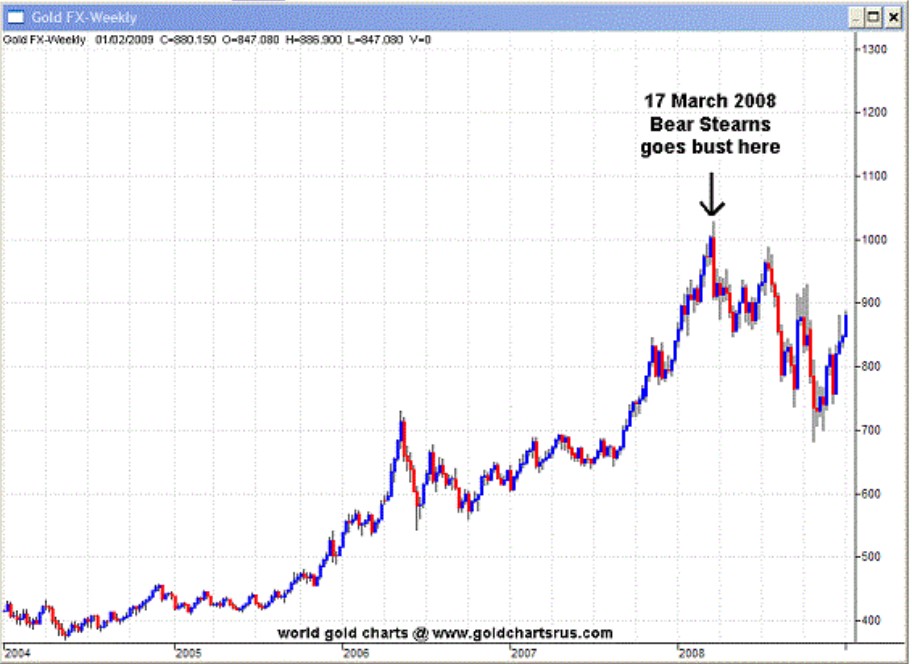
Another sources claim that additional reasons behind, why Bears cash funds suddenly drained-up during couple of day, could be that they had unbelievebly large short position on Gold and Silver COMEX contracts. Further, the day of Bear Stearns’ demise coincides precisely with the day of the historic high price points in gold and silver (gold was topping the $ 1,000 mark). Having said that it may be possible that those short contracts faced huge margin calls resulting to a cumulative demand for upwards of $2.5 billion in cash deposits. It was no coincidence the music stopped for Bear Stearns that same day (see that below attached chart).
After, Bear didn’t have enough cash to open for business the next morning, so it asked its core bank, JP Morgan Chase, for a $25 billion overnight loan. Chase CEO Jamie Dimon needed more time to research Bear’s real value before making a commitment. He asked the New York Federal Reserve bank to guarantee this bridge loan, so that Bear could open on next day. Yet, the Bear’s stock price continued in free fall and that week, its market capitalisation was worth only $236 million. That was just one-fifth the value of its headquarters building. To solve the problem and to prevent from domino effect, the Federal Reserve held its first emergency weekend meeting in 30 years.
The agreement between The FED and JP Chase was very critical at that time, because the markets already felt in the air the storm coming, and JP Chase would default pretty soon, if Bear did not have enough assets to pay off this rescue loan facility. In other words, without the Fed’s intervention, the failure of Bear Stearns could have spread to other over-leveraged investment banks. These included Merrill Lynch, Lehman Brothers, and Citigroup. After the weekend, JP Morgan Chase bough entire firm Bear Stearns for sketchy price of $ 2 per share (that was afterwards increased to $ 11 during the court litigations). However, Chase CEO Jamie Dimon later admitted that he regreted to buy Bearns, which costed him additional $20 billion incl. Legal costs, but main damage was done to JP Chase reputation with regard to its assets quality, that put on the radar of other market players. And they were not alone, Lehman Brothers were next on the list, so it was no wonder that it had taken less than six months till another major crisis was about to happen.
Lehman had a sister, her nam was AIG
Upcoming period of September 2008 was really hot on the financial markets, despite the summer period was over. This was due to fact that Lehman Brothers was not the only institution getting hit hard, this time it was about the likelyhood that domino fall would alternativelly put entire economy into the abyss.
During these days, it was already clear, that housing boom was over and subprime mortgages crisis totally spunn out of control and was about to spread through entire sector. The things have accelerated quite quickly during 1st September week, when the largest U.S. based providers of mortgages, Freddie Mac and Freddie Mae having total debt of $ 12 trillion, were saved by U.S. FED, after their shares have cratered to the ground. After this unprecedent step, all worries on the market turned to other investment banks that had the largest exposure towards the subprime mortgages. But, banks were not the only entities facing the disaster.
Within the whole funding structure for mortgage-based securities incl. CDOs, there were also insurance providers taking part, which played instrumental role there. This was simply due to the fact, that when all the mortgages were bundled into one product and sold on the market as commonly traded securities (like CDOs), their buyers could not evaluate the risk profile of single each individuals, who were lending the money to buy the properties. In this sense, the insurance companies were providing insurance for those securities, so that these debt placements could bear also some rating (equivalent mostly to the rating of insurance provider). Such instruments were traded as Credit default swaps (CDS). In addition, these instruments were aimed to protect investors (who bought CDO) to suffer from loss based on market value of the properties, as mentioned above, subprime mortgages were primarily Loan-to-value driven with unsound expactation for future growth of housing market. Over the course of these agreements, the value of the underlying asset will change, and one party will pay the other money, called collateral, based on that change; that collateral can flow back and forth between the two parties as the market moves.
Among the largest insurance providers there was insurance gigant American International Group (AIG), a global company with about $1 trillion in assets prior to the crisis, lost nearly $99.2 billion in 2008. AIG had in its portfolio written credit default swaps on over $500 billion for various securities, but only $78 billion in credit default swaps on collateralized debt obligations. Further, the CDO insurance product was a big success, for a while. In about five years, the division’s revenues rose from $737 million to more than $3 billion, about 17% of the company’s total.
So how it was possible to take down so huge insurance gigant to its knees? AIG problem was that there was no way how to re-insure this position elsewhere, like in other cases of commercial insurance. CDS represented pure one-way bet with open position. In other words, to cover potential problems, AIG needed to set aside decent amount of reserves, in case the residentail market decline.
AIG’s credit default swaps did not call for collateral to be paid in full due to market changes. In most cases, the agreement said that the collateral was owed only if market changes exceeded a certain value or if AIG’s credit rating fell below a certain level. In certain perception, these agreements were close to a margin call settlement for FX Derivatives, as they are in place now.
Through the entire period of subprime mortgages crisis, AIG was only accruing unpaid debts representing collateral it owed to its credit default swap partners, but did not have to hand over. Until September 15, when all three major agencies downgraded AIG to a credit rating below AA-, those collateral provisions kicked in and AIG was suddenly asked to pay-out a huge amount of money to its counterparties. Specifically, this amount was $32 billion due immediatelly and AIG was short of cash around $12.4 billion after that.
One could wonder, how could an insurance entity, which is generating cash excess based on the core insurance business, suddenly become cash-strapped? Obviously, the main reason is to be found in wrong investments, because cash excess is not usually kept on current account, but re-invested into some safe assets. And these assets, were ultimatelly supposed to be…high-yielded securities like CDOs (no wonder, as securities had a AAA credit rating). The values of the securities underlying these transactions were falling, due to falling real estate prices and higher foreclosures, and AIG did not have enough other liquid assets to meet all the redemption requests coming from under-written CDS transactions. On September 16 of that year, the Federal Reserve Bank of New York stepped in with an $85 billion loan to keep the failing company from going under, which was the largest FED bail-out of an privately owned company. Later, the terms of the deal were reworked and the debt grew. The Federal Reserve and the Treasury Department poured even more money into AIG, bringing the total up to an estimated $150 billion. On the positive note, the entire loan to AIG was repaid in ten years, including the interests over $20 billion.
Lehman Brothers was established in 1844, and during the 1980s it has positioned itself among the leaders on investment banking sector and even created an joint-venture with payment cards provider American Express. After nearly 10 years of cooperation, which did not bring any substantial added value, Lehman Brothers was spun off in 1994 through IPO. And, after the 1999 repeal of the Glass-Steagall Act (which was initially aimed to ban the combining of commercial and investment banking activities), Lehman Brothers expanded the offering of its proprietary banking, securities trading and asset management services, which may have been the beginning of the end.
During the mid-2000s, the housing boom was in full force, and Lehman, like many other firms, were becoming more and more heavily involved in issuing mortgage-backed securities and CDOs. However, Lehman took it to the next level between 2003 and 2004 by extending the core business into mortgage loans origination by acquiring, BNC Mortgage and Aurora Loan Services – both of which specialized in subprime loans.
Between 2004 and 2006, the capital markets unit surged 56% due to Lehman’s real estate businesses, causing the firm to become one of the fastest-growing investment banking and asset management businesses than its rivals. By 2007, Lehman was reporting big results with $19.3 billion in revenues and a record $4.2 billion net income.
Despite the clear signs of unsustainable subprime mortgages and housing market going to crash Lehmans still continued in increasing its share of the real estate business to the balance exceeding $110 billion in assets and securities in 2007.
When Lehman Brothers’ competitor Bear Stearns went under, being bought out by J.P. Morgan Chase in a Federal Reserve-backed deal in Q1 2008, Lehman’s fate was thrown into question. The main weakeness proved to be its reliance on repurchasing agreements (“repos”) securing the short-term funding for daily operations. This was due to fact that they had almost no retail network, so that they used to be financed solely from whole-sale (inter-bank) funds. So that, Lehman had to bolster the confidence of its investors in a short time by raising some $6 billion in equity in June of 2008. But this wasn’t as convincing as the firm had hoped.
By September, Lehman was announcing an expected $3.9 billion loss in its third quarter, connected with $5.6 billion loss in write-off related to those CDOs and similar securities. But in a desperate attempt to keep its head above water, Lehman claimed to have boosted its liquidity to around $45 billion, decreased mortgages by 20%, and reduced its leverage ratio.
Despite these measures, after the firm announced its intention to spin off $50 billion in toxic assets to a side company in September, ratings agency Moody’s considered downgrading Lehman’s debt rating, and the Federal Reserve met to consider the firm’s future. The latest development on market was clearly starting to unleash into great instability and domino effect was about to endanger another market players.
As the all previously announced measures to keep the firm afloat by selling off asset management units, trying to develop a joint-venture with Korea Development Bank for aid, resp. spinning off commercial real estate assets units went in vane, Lehman’s stock dropped drastically about 77% in the first week of September. As a result of this, other market players simply were not willing to prolong existing repos transactions and at the end of next week, Lehman was left with only $1 billion in cash.
During this weekend, the phones kept ringing on all continents, with the only intention to spread-out the communication between the bankers, governers, regulators and finance ministers, how to save the rest of the market. According to Fed Chair Ben Bernanke, Treasury secretary Henry Paulson, and Timothy Geithner, president of the Federal Reserve Bank of New York, other firms like Bear Stearns and AIG had collateral that was used to cover the bailout, while Lehman did not. Well, this maight have been right, but how could they tell after analysing Lehman balance sheet only for couple of hours? The most likely answer seems to be, that they made decision not to bail-out Lehmans in order to save the ammos for another rescue plan, which would cost a lot of more money (to save the rest).
The only last chance was seen in buying the Lehmans by UK based Barclays bank, which might have made certain sense, as Lehman Brothers had also Investment banking arm in London as well, so that Barclays could expand on this take-over. But, as the amount of all toxic assets in the books of Lehman Brothers was easy to investigate during the weekend and Federal Reserve Bank was not going to provide any guarantee, the deal was off the table quite quickly.
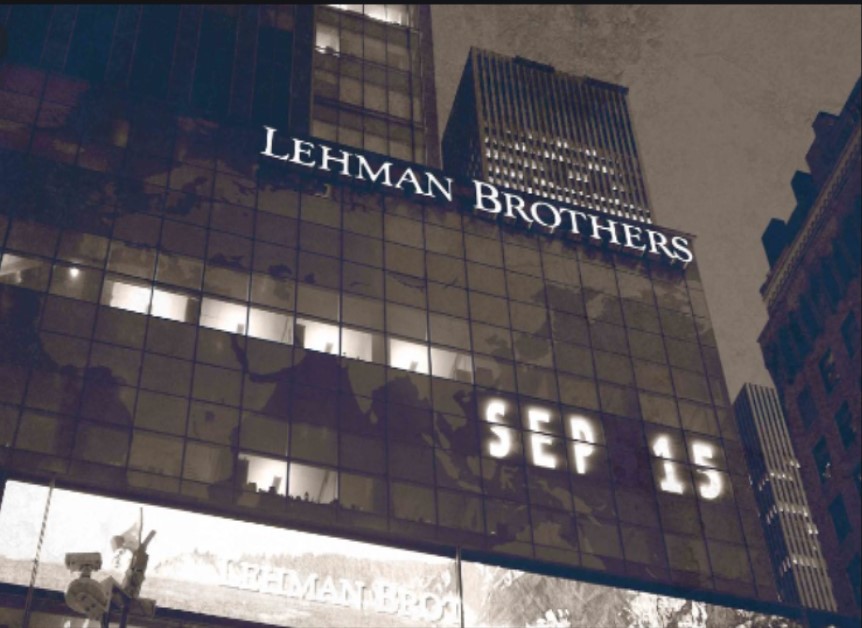
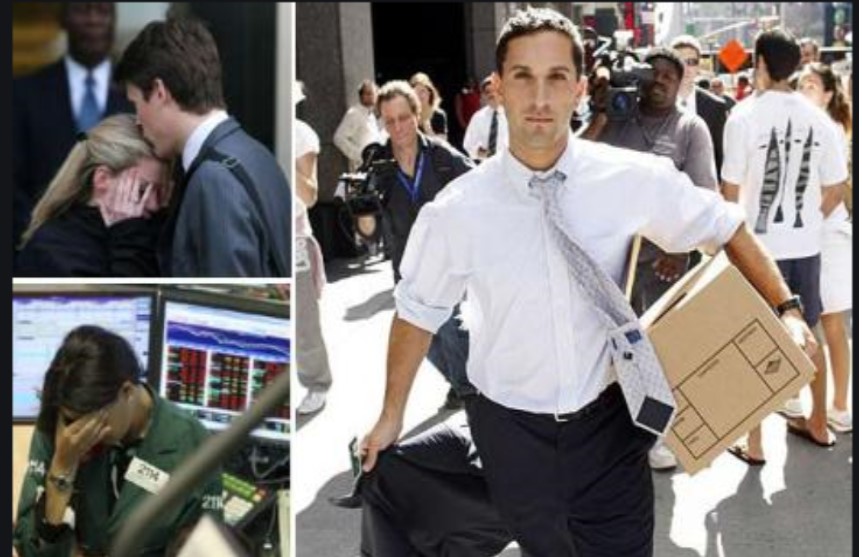
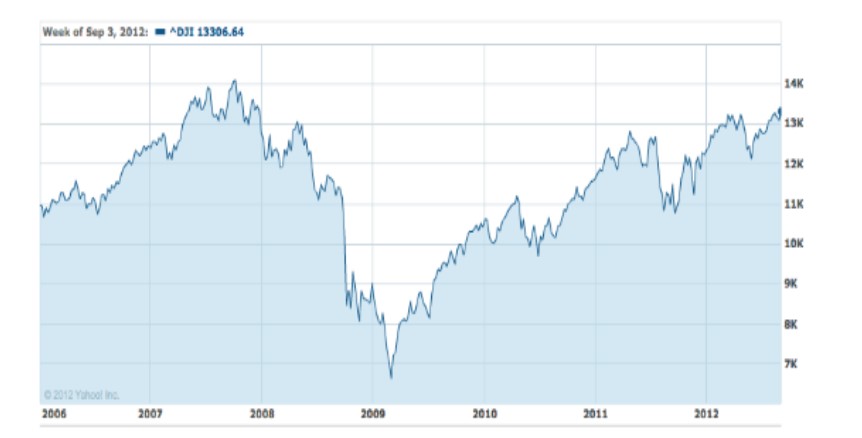
Next morning, on Sept. 15, 2008, Lehman Brothers officially declared bankruptcy, causing the firm’s stock to plummet by a final 93% from its standing just three days prior. The markets were turning to the south and mainly financial sector was stumbling. For instance, among other market players, Citigroup representing one of the largest financial conglomerate world-wide, its stock price even dropped below one US Dollar per share, which was the lowest value in 20 years. This was accompanied with the continuous decline of the Dow Jones Industrial Index in the last decade (from top around 14,000 in 4Q 2007 down below 7,000 in 1Q 2009).
Just two days after Lehman collapsed, the Americans bailed out the giant insurer AIG, which had guaranteed the banks’ multibillion-dollar exposure to sub-prime loans. Without a bailout, many more banks would have followed Lehman into bankruptcy.
Following the urgency of the situation, the remaining investment banks active on the market like Merill Lynch (sold to Bank of America), JP Morgan and Morgan Stanley agreed to merge with other commercial banks, so that they could sustain market pressures and benefit from federal financial support. Afterwards, the banks and investment firms could put their toxic loans up to $700 billion into a Troubled Asset Relief Programme (TARP).
Key take-aways
While there were several factors contributing to Lehman collapse, many experts seem to agree that it was in large part due to a lack of trust, over-leveraging, poor long-term investments and high share of toxic assets in balance sheet, and finally unstable funding. Banks were using each other to fund their businesses rather than depositors, which are placing their money into savings account held with commercial banks.
According to Douglas Flint, former chairman of HSBC, Britain’s largest bank, it was very clear that many investment banks were dependent on being able to roll over short-term liquidity funds, and it was quite appearent that the parcel of unencumbered assets being used as collateral was getting smaller thus limitating the manevrous space for the banks.
Problems first surfaced in the American sub-prime mortgage market, where too many home loans had been extended to borrowers with no chance of ever repaying them. There was even a nickname for them – “ninja” loans, for people with no income and no job or assets. Those risky loans were bundled up with less risky ones and sold off in parcels to banks around the world. The belief was that these collateralised securities offered high returns at minimal risk. The belief was that not all mortgage borrowers would default at the same time. But, that belief was naturally wrong.
And while the firm itself was simply one of many factors contributing to the economic disaster that was 2008 and beyond, it was perhaps the catalyst of the collapse of the banking and housing industries, and proved that even those that boast enormous success one year can be bankrupt the next.
The fallout from Lehman Brothers’ collapse was nothing short of disastrous, as following consequencies took place:
- the Banks have been temporarily short of funds, as there was quite weak liquidity on the market and financing costs increased
- entire economy was hit dramatically, as nations growth was muted world-wide (for instance some over-leveragged countries like Iceland, Hungary, Latvia etc. almost declared state bankruptcy while other countries like Spain, Portugal needed EU financial support)
- Unemployement hit the record levels in long-term view after 2008 (close to 10%), around 6 million jobs were lost only in USA
- financial market regulation was also strengthened with various rules and agenda (e.g. Dodd-Frank Act was implemented in USA, regular bank stress-testing was put in place, increased requirements for collateral margining between banks etc.)
- the Banks also seeked for state support to improve their capital standings, which was however conditioned with reduced Dividends pay-out policy and requirement for selling off the non-core activities (for instance former “banco-insurance” houses had to be separated)
- Central Banks world-wide had launched QE Programmes (Quantitative Easeninng) while reducing the interest rates and/or buying specific securities like Government Bonds etc. with aim to pump-up sufficient liquidity into financial markets. This was intented to support sluggish global growth, so that world economies and nations would not fall into recession again.
202X) Global pandemic crisis 2.0
…story to be continued.
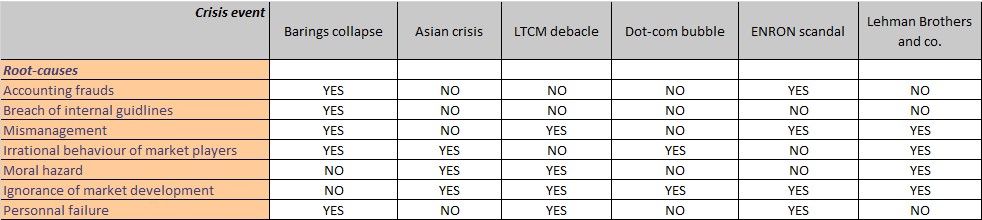
Afore attached Picture shows the comparison and analogy of main root-causes with individual crisis events, as they have been described in previous text.
Reference links:
- https://en.wikipedia.org/wiki/Barings_Bank
- https://www.thejournal.ie/nick-leeson-barings-1957799-Feb2015/
- https://www.theguardian.com/business/from-the-archive-blog/2015/feb/24/nick-leeson-barings-bank-1995-20-archive
- LTCM Crisis – Case Study http://www.bauer.uh.edu/rsusmel/7386/ltcm-2.html
- http://www.investmentreview.com/print-archives/winter-1999/the-story-of-long-term-capital-management-752/
- Case Study: Collapse of Long-Term Capital Management – http://financetrain.com/case-study-collapse-of-long-term-capital-management/
- https://www.slideshare.net/saurabhmittra/collapse-of-lonng-term-management-fixed-income-project
- IMF’s World Economic Outlook, May 1998
- https://www.britannica.com/topic/Arthur-Andersen#ref1254077
- https://www.thebalancesmb.com/sarbanes-oxley-act-and-the-enron-scandal-393497
- https://www.forbes.com/2002/01/15/0115enron.html#2e1994c83c9c
- McDonald, Robert L., and Anna Paulson. 2014. “AIG in Hindsight”. Journal of Economic Perspectives. 29
- https://www.thebalance.com/bearn-stearns-collapse-and-bailout-3305613
- https://www.theguardian.com/business/2013/sep/13/lehman-brothers-collapse-five-years-later-shiver-spine
- https://www.thestreet.com/markets/lehman-brothers-collapse-14703153
- What Really Happened To Bear Stearns? By Theodore Butler, February 17, 2014
- “https://www.moodys.com/research/Moodys-Downgrades-Bear-Stearns-Alt-A-Deals–PR_150642”
- https://www.thestreet.com/politics/glass-steagall-act-14929574
- https://www.investopedia.com/articles/economics/09/american-investment-group-aig-bailout.asp
- https://www.history.com/this-day-in-history/lehman-brothers-collapses
- https://www.theguardian.com/business/2009/sep/04/lehman-collapse-global-impact